估算会员奖励计划的效果#
一个示例,说明如何使用 DoWhy 估算客户订阅或奖励计划的效果。
假设某个网站有一个会员奖励计划,客户注册后可以获得额外福利。我们如何知道该计划是否有效?这里的相关因果问题是:> 提供会员奖励计划对总销售额有何影响?
相应的反事实问题是:> 如果现有会员没有注册该计划,他们在网站上的花费会减少多少?
用正式语言来说,我们感兴趣的是处理组的平均处理效应 (ATT)。
一、建立因果模型#
假设该奖励计划于 2019 年 1 月推出。结果变量是年末的总花费。我们拥有每个用户的所有月度交易数据,以及选择注册奖励计划的用户注册时间的数据。以下是数据示例。
[1]:
# Creating some simulated data for our example
import pandas as pd
import numpy as np
num_users = 10000
num_months = 12

signup_months = np.random.choice(np.arange(1, num_months), num_users) * np.random.randint(0,2, size=num_users) # signup_months == 0 means customer did not sign up
df = pd.DataFrame({
    'user_id': np.repeat(np.arange(num_users), num_months),
    'signup_month': np.repeat(signup_months, num_months), # signup month == 0 means customer did not sign up
    'month': np.tile(np.arange(1, num_months+1), num_users), # months are from 1 to 12
    'spend': np.random.poisson(500, num_users*num_months) #np.random.beta(a=2, b=5, size=num_users * num_months)*1000 # centered at 500
})
# A customer is in the treatment group if and only if they signed up
df["treatment"] = df["signup_month"]>0
# Simulating an effect of month (monotonically decreasing--customers buy less later in the year)
df["spend"] = df["spend"] - df["month"]*10
# Simulating a simple treatment effect of 100
after_signup = (df["signup_month"] < df["month"]) & (df["treatment"])
df.loc[after_signup,"spend"] = df[after_signup]["spend"] + 100
df
[1]:
| 用户 ID | 注册月份 | 月份 | 花费 | 处理 | |
|---|---|---|---|---|---|
| 0 | 0 | 1 | 1 | 449 | True |
| 1 | 0 | 1 | 2 | 583 | True |
| 2 | 0 | 1 | 3 | 519 | True |
| 3 | 0 | 1 | 4 | 581 | True |
| 4 | 0 | 1 | 5 | 549 | True |
| ... | ... | ... | ... | ... | ... |
| 119995 | 9999 | 0 | 8 | 410 | False |
| 119996 | 9999 | 0 | 9 | 409 | False |
| 119997 | 9999 | 0 | 10 | 398 | False |
| 119998 | 9999 | 0 | 11 | 401 | False |
| 119999 | 9999 | 0 | 12 | 394 | False |
120000 行 × 5 列
时间的重要性#
时间在建模此问题中起着至关重要的作用。
奖励注册会影响未来的交易,但不会影响注册之前的交易。事实上,可以认为奖励注册之前的交易导致了奖励注册的决定。因此,我们为每个用户拆分变量
处理前的活动(假定是处理的原因)
处理后的活动(是应用处理的结果)
当然,许多影响注册和总花费的重要变量缺失(例如,购买的产品类型、用户账户时长、地理位置等)。这是分析中的一个关键假设,需要稍后使用反驳测试进行检验。
下图是一个在第 i=3 月份注册的用户的因果图。对任何 i,分析过程都类似。
[2]:
import dowhy

# Setting the signup month (for ease of analysis)
i = 3
[3]:
causal_graph = """digraph {
treatment[label="Program Signup in month i"];
pre_spends;
post_spends;
Z->treatment;
pre_spends -> treatment;
treatment->post_spends;
signup_month->post_spends;
signup_month->treatment;
}"""

# Post-process the data based on the graph and the month of the treatment (signup)
# For each customer, determine their average monthly spend before and after month i
df_i_signupmonth = (
    df[df.signup_month.isin([0, i])]
    .groupby(["user_id", "signup_month", "treatment"])
    .apply(
        lambda x: pd.Series(
            {
                "pre_spends": x.loc[x.month < i, "spend"].mean(),
                "post_spends": x.loc[x.month > i, "spend"].mean(),
            }
        )
    )
    .reset_index()
)
print(df_i_signupmonth)
model = dowhy.CausalModel(data=df_i_signupmonth,
                     graph=causal_graph.replace("\n", " "),
                     treatment="treatment",
                     outcome="post_spends")
model.view_model()
from IPython.display import Image, display
display(Image(filename="causal_model.png"))
      user_id  signup_month  treatment  pre_spends  post_spends
0           2             0      False       479.0   390.888889
1           4             3       True       487.0   522.444444
2           6             0      False       482.5   422.888889
3           8             0      False       473.0   418.444444
4          10             0      False       489.0   424.333333
...       ...           ...        ...         ...          ...
5326     9987             0      False       480.0   414.000000
5327     9990             0      False       495.5   421.777778
5328     9992             0      False       473.0   405.666667
5329     9996             0      False       490.0   415.555556
5330     9999             0      False       482.0   420.111111

[5331 rows x 5 columns]
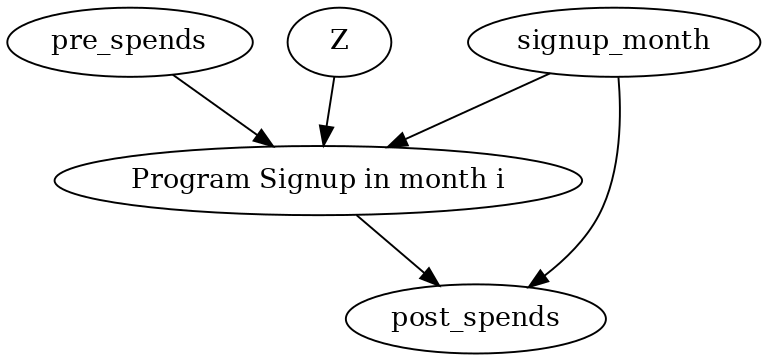
更一般地,我们可以将客户的任何活动数据包含在上述图中。所有处理前和处理后的活动数据将与花费金额节点(分别对应处理前和处理后)占据相同的位置(并具有相同的边)。
二、识别因果效应#
为了本示例的目的,我们假设未观测到的混杂因素影响不大。
[4]:
identified_estimand = model.identify_effect(proceed_when_unidentifiable=True)
print(identified_estimand)
Estimand type: nonparametric-ate

### Estimand : 1
Estimand name: backdoor
Estimand expression:
     d
────────────(Expectation(post_spends|signup_month))
d[treatment]
Estimand assumption 1, Unconfoundedness: If U→{treatment} and U→post_spends then P(post_spends|treatment,signup_month,U) = P(post_spends|treatment,signup_month)

### Estimand : 2
Estimand name: iv
Estimand expression:
Expectation(Derivative(post_spends, [Z, pre_spends])*Derivative([treatment], [
Z, pre_spends])**(-1))
Estimand assumption 1, As-if-random: If U→→post_spends then ¬(U →→{Z,pre_spends})
Estimand assumption 2, Exclusion: If we remove {Z,pre_spends}→{treatment}, then ¬({Z,pre_spends}→post_spends)

### Estimand : 3
Estimand name: frontdoor
No such variable(s) found!
基于该图,DoWhy 确定需要根据注册月份和处理前月份的花费金额(signup_month, pre_spend)进行条件调整。
三、估算效应#
我们现在基于后门可估计项来估算效应,并将目标单位设置为“att”。
[5]:
estimate = model.estimate_effect(identified_estimand,
                                 method_name="backdoor.propensity_score_matching",
                                target_units="att")
print(estimate)
/home/amit/py-envs/env3.8/lib/python3.8/site-packages/sklearn/utils/validation.py:993: DataConversionWarning: A column-vector y was passed when a 1d array was expected. Please change the shape of y to (n_samples, ), for example using ravel().
  y = column_or_1d(y, warn=True)
*** Causal Estimate ***

## Identified estimand
Estimand type: nonparametric-ate

### Estimand : 1
Estimand name: backdoor
Estimand expression:
     d
────────────(Expectation(post_spends|signup_month))
d[treatment]
Estimand assumption 1, Unconfoundedness: If U→{treatment} and U→post_spends then P(post_spends|treatment,signup_month,U) = P(post_spends|treatment,signup_month)

## Realized estimand
b: post_spends~treatment+signup_month
Target units: att

## Estimate
Mean value: 97.57746107152285
该分析结果告知我们处理组的平均处理效应 (ATT)。也就是说,对于在第 i=3 月注册奖励计划的客户(与他们未注册的情况相比),对总花费的平均影响。我们可以通过更改 i 的值(上面第 2 行)并重新运行分析,来计算在其他任何月份注册的客户的效果。
请注意,估计存在左截尾和右截尾问题。1. 左截尾:如果客户在第一个月注册,我们没有足够的交易历史来将其与未注册的相似客户进行匹配(从而应用后门识别的可估计项)。2. 右截尾:如果客户在最后一个月注册,我们没有足够的未来(处理后)交易来估算注册后的结果。
因此,即使注册的效果在所有月份都相同,由于数据不足(以及由此导致的处理前或处理后交易活动估计方差较高),估计效果可能因注册月份而异。
四、反驳估算结果#
我们使用安慰剂处理反驳器来反驳估算结果。该反驳器将处理替换为一个独立的随机变量,并检查我们的估算结果是否变为零(应该是零!)。
[6]:
refutation = model.refute_estimate(identified_estimand, estimate, method_name="placebo_treatment_refuter",
                     placebo_type="permute", num_simulations=20)
print(refutation)
/home/amit/py-envs/env3.8/lib/python3.8/site-packages/sklearn/utils/validation.py:993: DataConversionWarning: A column-vector y was passed when a 1d array was expected. Please change the shape of y to (n_samples, ), for example using ravel().
  y = column_or_1d(y, warn=True)
/home/amit/py-envs/env3.8/lib/python3.8/site-packages/sklearn/utils/validation.py:993: DataConversionWarning: A column-vector y was passed when a 1d array was expected. Please change the shape of y to (n_samples, ), for example using ravel().
  y = column_or_1d(y, warn=True)
/home/amit/py-envs/env3.8/lib/python3.8/site-packages/sklearn/utils/validation.py:993: DataConversionWarning: A column-vector y was passed when a 1d array was expected. Please change the shape of y to (n_samples, ), for example using ravel().
  y = column_or_1d(y, warn=True)
/home/amit/py-envs/env3.8/lib/python3.8/site-packages/sklearn/utils/validation.py:993: DataConversionWarning: A column-vector y was passed when a 1d array was expected. Please change the shape of y to (n_samples, ), for example using ravel().
  y = column_or_1d(y, warn=True)
/home/amit/py-envs/env3.8/lib/python3.8/site-packages/sklearn/utils/validation.py:993: DataConversionWarning: A column-vector y was passed when a 1d array was expected. Please change the shape of y to (n_samples, ), for example using ravel().
  y = column_or_1d(y, warn=True)
/home/amit/py-envs/env3.8/lib/python3.8/site-packages/sklearn/utils/validation.py:993: DataConversionWarning: A column-vector y was passed when a 1d array was expected. Please change the shape of y to (n_samples, ), for example using ravel().
  y = column_or_1d(y, warn=True)
/home/amit/py-envs/env3.8/lib/python3.8/site-packages/sklearn/utils/validation.py:993: DataConversionWarning: A column-vector y was passed when a 1d array was expected. Please change the shape of y to (n_samples, ), for example using ravel().
  y = column_or_1d(y, warn=True)
/home/amit/py-envs/env3.8/lib/python3.8/site-packages/sklearn/utils/validation.py:993: DataConversionWarning: A column-vector y was passed when a 1d array was expected. Please change the shape of y to (n_samples, ), for example using ravel().
  y = column_or_1d(y, warn=True)
/home/amit/py-envs/env3.8/lib/python3.8/site-packages/sklearn/utils/validation.py:993: DataConversionWarning: A column-vector y was passed when a 1d array was expected. Please change the shape of y to (n_samples, ), for example using ravel().
  y = column_or_1d(y, warn=True)
/home/amit/py-envs/env3.8/lib/python3.8/site-packages/sklearn/utils/validation.py:993: DataConversionWarning: A column-vector y was passed when a 1d array was expected. Please change the shape of y to (n_samples, ), for example using ravel().
  y = column_or_1d(y, warn=True)
/home/amit/py-envs/env3.8/lib/python3.8/site-packages/sklearn/utils/validation.py:993: DataConversionWarning: A column-vector y was passed when a 1d array was expected. Please change the shape of y to (n_samples, ), for example using ravel().
  y = column_or_1d(y, warn=True)
/home/amit/py-envs/env3.8/lib/python3.8/site-packages/sklearn/utils/validation.py:993: DataConversionWarning: A column-vector y was passed when a 1d array was expected. Please change the shape of y to (n_samples, ), for example using ravel().
  y = column_or_1d(y, warn=True)
/home/amit/py-envs/env3.8/lib/python3.8/site-packages/sklearn/utils/validation.py:993: DataConversionWarning: A column-vector y was passed when a 1d array was expected. Please change the shape of y to (n_samples, ), for example using ravel().
  y = column_or_1d(y, warn=True)
/home/amit/py-envs/env3.8/lib/python3.8/site-packages/sklearn/utils/validation.py:993: DataConversionWarning: A column-vector y was passed when a 1d array was expected. Please change the shape of y to (n_samples, ), for example using ravel().
  y = column_or_1d(y, warn=True)
/home/amit/py-envs/env3.8/lib/python3.8/site-packages/sklearn/utils/validation.py:993: DataConversionWarning: A column-vector y was passed when a 1d array was expected. Please change the shape of y to (n_samples, ), for example using ravel().
  y = column_or_1d(y, warn=True)
/home/amit/py-envs/env3.8/lib/python3.8/site-packages/sklearn/utils/validation.py:993: DataConversionWarning: A column-vector y was passed when a 1d array was expected. Please change the shape of y to (n_samples, ), for example using ravel().
  y = column_or_1d(y, warn=True)
/home/amit/py-envs/env3.8/lib/python3.8/site-packages/sklearn/utils/validation.py:993: DataConversionWarning: A column-vector y was passed when a 1d array was expected. Please change the shape of y to (n_samples, ), for example using ravel().
  y = column_or_1d(y, warn=True)
/home/amit/py-envs/env3.8/lib/python3.8/site-packages/sklearn/utils/validation.py:993: DataConversionWarning: A column-vector y was passed when a 1d array was expected. Please change the shape of y to (n_samples, ), for example using ravel().
  y = column_or_1d(y, warn=True)
/home/amit/py-envs/env3.8/lib/python3.8/site-packages/sklearn/utils/validation.py:993: DataConversionWarning: A column-vector y was passed when a 1d array was expected. Please change the shape of y to (n_samples, ), for example using ravel().
  y = column_or_1d(y, warn=True)
/home/amit/py-envs/env3.8/lib/python3.8/site-packages/sklearn/utils/validation.py:993: DataConversionWarning: A column-vector y was passed when a 1d array was expected. Please change the shape of y to (n_samples, ), for example using ravel().
  y = column_or_1d(y, warn=True)
Refute: Use a Placebo Treatment
Estimated effect:97.57746107152285
New effect:1.251821060965955
p value:0.430226053357455