使用 ID 算法识别效应#
这是一个教程笔记本,用于在因果推断的因果识别步骤中使用 ID 算法。
论文链接:https://ftp.cs.ucla.edu/pub/stat_ser/shpitser-thesis.pdf 伪代码在第 40 页提供。
[1]:
from dowhy import CausalModel
import pandas as pd
import numpy as np
from IPython.display import Image, display
示例#
以下部分展示了 ID 算法在多个测试用例上的工作情况。在图中,**T** 表示处理变量,**Y** 表示结果变量,**Xs** 是附加变量。
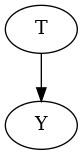
案例 1#
此示例展示了该算法在最简单的图上的性能。
[2]:
# Random data
treatment = "T"
outcome = "Y"
causal_graph = "digraph{T->Y;}"
columns = list(treatment) + list(outcome)
df = pd.DataFrame(columns=columns)

# Causal Model Initialization
causal_model = CausalModel(df, treatment, outcome, graph=causal_graph)

# View graph
causal_model.view_model()
from IPython.display import Image, display
print("Graph:")
display(Image(filename="causal_model.png"))

# Causal Identification using the ID Algorithm
identified_estimand = causal_model.identify_effect(method_name="id-algorithm")
print("\nResult for identification using ID Algorithm:")
print(identified_estimand)
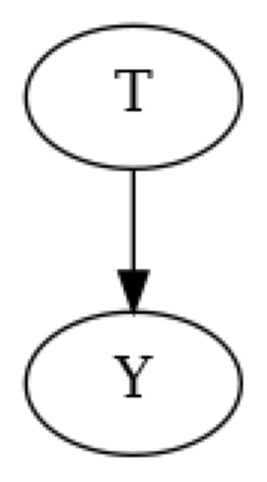
Graph:
Result for identification using ID Algorithm:
Predictor: P(Y|T)
案例 2#
此示例展示了该算法在循环图上的性能。此示例表明 ID 算法需要有向无环图 (DAG)。
[3]:
# Random data
treatment = "T"
outcome = "Y"
causal_graph = "digraph{T->Y; Y->T;}"
columns = list(treatment) + list(outcome)
df = pd.DataFrame(columns=columns)

# Causal Model Initialization
causal_model = CausalModel(df, treatment, outcome, graph=causal_graph)

# View graph
causal_model.view_model()
from IPython.display import Image, display
print("Graph:")
display(Image(filename="causal_model.png"))

try:
    # Causal Identification using the ID Algorithm
    identified_estimand = causal_model.identify_effect(method_name="id-algorithm")
    print("\nResult for identification using ID Algorithm:")
    print(identified_estimand)
except:
    print("Identification Failed: The graph must be a directed acyclic graph (DAG).")
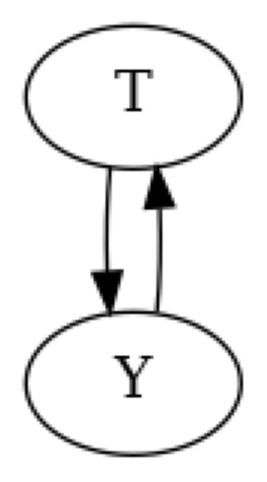
Graph:
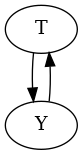
Identification Failed: The graph must be a directed acyclic graph (DAG).
案例 3#
此示例展示了算法在存在中介变量(**X1**)时的性能。
[4]:
# Random data
treatment = "T"
outcome = "Y"
variables = ["X1"]
causal_graph = "digraph{T->X1;X1->Y;}"
columns = list(treatment) + list(outcome) + list(variables)
df = pd.DataFrame(columns=columns)

# Causal Model Initialization
causal_model = CausalModel(df, treatment, outcome, graph=causal_graph)

# View graph
causal_model.view_model()
from IPython.display import Image, display
print("Graph:")
display(Image(filename="causal_model.png"))

# Causal Identification using the ID Algorithm
identified_estimand = causal_model.identify_effect(method_name="id-algorithm")
print("\nResult for identification using ID Algorithm:")
print(identified_estimand)
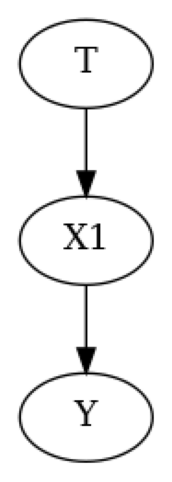
Graph:
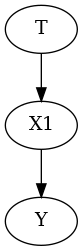
Result for identification using ID Algorithm:
Sum over {X1}:
        Predictor: P(X1|T)
        Predictor: P(Y|T,X1)
案例 4#
此示例展示了算法在存在从 **T** 到 **Y** 的直接路径和间接路径(通过 **X1**)时的性能。
[5]:
# Random data
treatment = "T"
outcome = "Y"
variables = ["X1"]
causal_graph = "digraph{T->Y;T->X1;X1->Y;}"
columns = list(treatment) + list(outcome) + list(variables)
df = pd.DataFrame(columns=columns)

# Causal Model Initialization
causal_model = CausalModel(df, treatment, outcome, graph=causal_graph)

# View graph
causal_model.view_model()
from IPython.display import Image, display
print("Graph:")
display(Image(filename="causal_model.png"))

# Causal Identification using the ID Algorithm
identified_estimand = causal_model.identify_effect(method_name="id-algorithm")
print("\nResult for identification using ID Algorithm:")
print(identified_estimand)
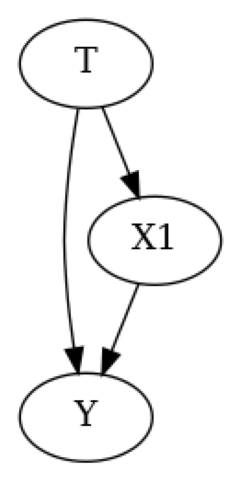
Graph:
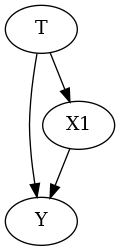
Result for identification using ID Algorithm:
Sum over {X1}:
        Predictor: P(Y|T,X1)
        Predictor: P(X1|T)
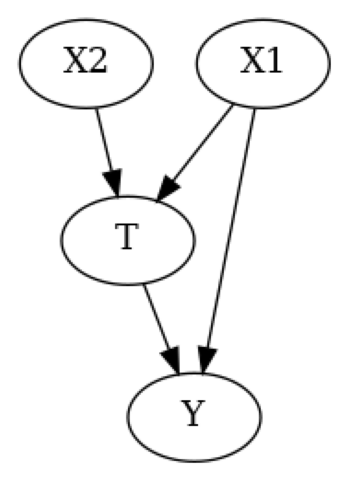
案例 5#
此示例展示了算法在存在混杂变量(**X1**)和工具变量(**X2**)时的性能。
[6]:
# Random data
treatment = "T"
outcome = "Y"
variables = ["X1", "X2"]
causal_graph = "digraph{T->Y;X1->T;X1->Y;X2->T;}"
columns = list(treatment) + list(outcome) + list(variables)
df = pd.DataFrame(columns=columns)

# Causal Model Initialization
causal_model = CausalModel(df, treatment, outcome, graph=causal_graph)

# View graph
causal_model.view_model()
from IPython.display import Image, display
print("Graph:")
display(Image(filename="causal_model.png"))

# Causal Identification using the ID Algorithm
identified_estimand = causal_model.identify_effect(method_name="id-algorithm")
print("\nResult for identification using ID Algorithm:")
print(identified_estimand)
Graph:
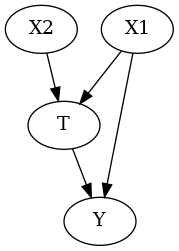
Result for identification using ID Algorithm:
Sum over {X1}:
        Predictor: P(Y|X1,X2,T)
        Predictor: P(X1)
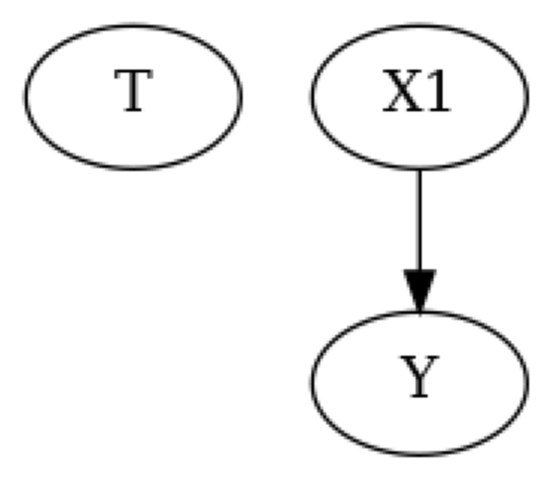
案例 6#
此示例展示了算法在非连通图上的性能。
[7]:
# Random data
treatment = "T"
outcome = "Y"
variables = ["X1"]
causal_graph = "digraph{T;X1->Y;}"
columns = list(treatment) + list(outcome) + list(variables)
df = pd.DataFrame(columns=columns)

# Causal Model Initialization
causal_model = CausalModel(df, treatment, outcome, graph=causal_graph)

# View graph
causal_model.view_model()
from IPython.display import Image, display
print("Graph:")
display(Image(filename="causal_model.png"))

# Causal Identification using the ID Algorithm
identified_estimand = causal_model.identify_effect(method_name="id-algorithm")
print("\nResult for identification using ID Algorithm:")
print(identified_estimand)
Graph:
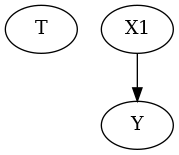
Result for identification using ID Algorithm:
Sum over {X1}:
        Predictor: P(X1,Y)
[ ]: