加载输入图的不同方法#
我们建议使用 GML 图格式加载图。您也可以使用 DOT 格式,但这需要额外的依赖(pydot 或 pygraphviz)。
DoWhy 支持将图加载为字符串或文件(扩展名为 ‘gml’ 或 ‘dot’)。
下面是一个示例,展示了加载同一图的不同方法。
[1]:
import os, sys
import random
sys.path.append(os.path.abspath("../../../"))
[2]:
import numpy as np
import pandas as pd

import dowhy
from dowhy import CausalModel
from IPython.display import Image, display
一、生成模拟数据#
我们生成了三个变量 X、Y 和 Z 的一些模拟数据。
[3]:
z=[i for i in range(10)]
random.shuffle(z)
df = pd.DataFrame(data = {'Z': z, 'X': range(0,10), 'Y': range(0,100,10)})
df
[3]:
| Z | X | Y | |
|---|---|---|---|
| 0 | 3 | 0 | 0 |
| 1 | 7 | 1 | 10 |
| 2 | 8 | 2 | 20 |
| 3 | 4 | 3 | 30 |
| 4 | 0 | 4 | 40 |
| 5 | 9 | 5 | 50 |
| 6 | 1 | 6 | 60 |
| 7 | 6 | 7 | 70 |
| 8 | 5 | 8 | 80 |
| 9 | 2 | 9 | 90 |
二、加载 GML 或 DOT 图#
GML 格式#
[4]:
# With GML string
model=CausalModel(
data = df,
treatment='X',
outcome='Y',
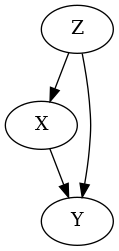
graph="""graph[directed 1 node[id "Z" label "Z"]
node[id "X" label "X"]
node[id "Y" label "Y"]
edge[source "Z" target "X"]
edge[source "Z" target "Y"]
edge[source "X" target "Y"]]"""
)
model.view_model()
display(Image(filename="causal_model.png"))


[5]:
# With GML file
model=CausalModel(
        data = df,
        treatment='X',
        outcome='Y',
        graph="../example_graphs/simple_graph_example.gml"
        )
model.view_model()


display(Image(filename="causal_model.png"))


DOT 格式#
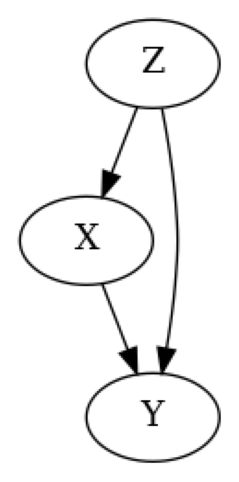
[6]:
# With DOT string
model=CausalModel(
        data = df,
        treatment='X',
        outcome='Y',
        graph="digraph {Z -> X;Z -> Y;X -> Y;}"
        )
model.view_model()

from IPython.display import Image, display
display(Image(filename="causal_model.png"))

[7]:
# With DOT file
model=CausalModel(
        data = df,
        treatment='X',
        outcome='Y',
        graph="../example_graphs/simple_graph_example.dot"
        )
model.view_model()


display(Image(filename="causal_model.png"))